THE ECONOMIC IMPACT OF BLACK-OWNED BUSINESSES IN THE CINCINNATI MSA
ECONOMIC IMPACT OF
BLACK-OWNED BUSINESSES
OUTPUT
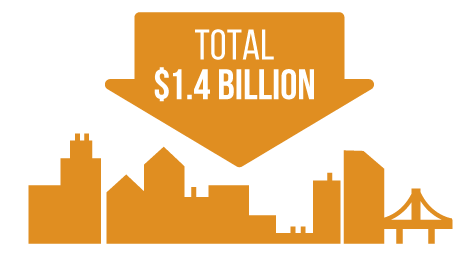
DIRECT - $755.2 Million
INDIRECT - $689.2 Million
JOBS
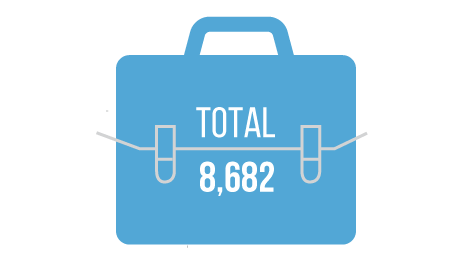
DIRECT - 4,739
INDIRECT - 3,943
WAGES
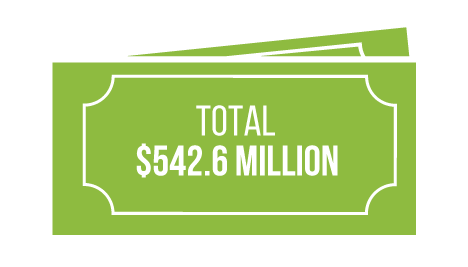
DIRECT - $287.5 Million
INDIRECT - $255.1 Million

“Our region and our businesses have much to celebrate. This impressive analysis from the UC Economics Center shows a robust number of growing enterprises, jobs created, and communities positively impacted by our Black businesses.”
Eric H. Kearney, AACC President and CEO
FISCAL IMPACT OF
BLACK-OWNED BUSINESSES

1.
The five Ohio counties in the Cincinnati MSA received more than $1.2 million in sales tax revenue due to the retail spending of the earnings.

2.
Income tax revenue generated for the Cincinnati MSA was calculated using the total earnings of $542.6 million resulting from the direct and indirect economic output of Black-owned businesses supported by expenditures in operations and total attendee spending.
3.
The States of Ohio, Kentucky, and Indiana collected approximately $6.2 million in sales tax revenue.*

4.
The Economics Center calculated a blended Cincinnati MSA income tax rate of 1.2 percent. Income tax revenue generated from the total earnings was approximately $6.5 million in 2020.†

3.
Overall, more than $13.9 million in sales and income tax revenue accrued to local and state governments in 2020 as a result of Black-owned businesses.
*Counties in Indiana and Kentucky do not levy a local sales tax.
†This calculation was $542,624,112 multiplied by the blended 1.2 percent MSA income tax rate.

“We have the data, now let’s take out the emotion and determine how we address the disparities that prevent this number from being larger. As we celebrate our 25th year, our focus is towards the next generation of entrepreneurs and building on this foundation to ensure our region is competitive."
Jason Dunn, AACC Board Chair
ANALYSIS OF SHARE OF BUSINESSES AND WAGES BY INDUSTRY
| Industry | Share of Companies | Share of Wages |
|---|---|---|
| Construction | 7% | 15% |
| Manufacturing | 3% | 2% |
| Wholesale Trade | 2% | 22% |
| Retail Trade | 10% | 1% |
| Transportation and Warehousing | 1% | 1% |
| Information | 2% | 1% |
| Finance and Insurance | 2% | 3% |
| Real Estate Rental and Leasing | 2% | 11% |
| Professional, Scientific, and Technical Services | 22% | 12% |
| Administrative and Support and Waste Management and Remediation Services | 8% | 5% |
| Educational Services | 3% | 1% |
| Health Care and Social Assistance | 12% | 10% |
| Arts, Entertainment, and Recreation | 2% | 1% |
| Accommodation and Food Services | 9% | 9% |
| Other Services | 14% | 7% |
Source: Economics Center’s Analysis using data from ODJFS and Emsi. Percentages do not sum due to rounding.